Team Reports and Analytics
Track how your team is using Mobile Locker to gain insights into what content drives sales.
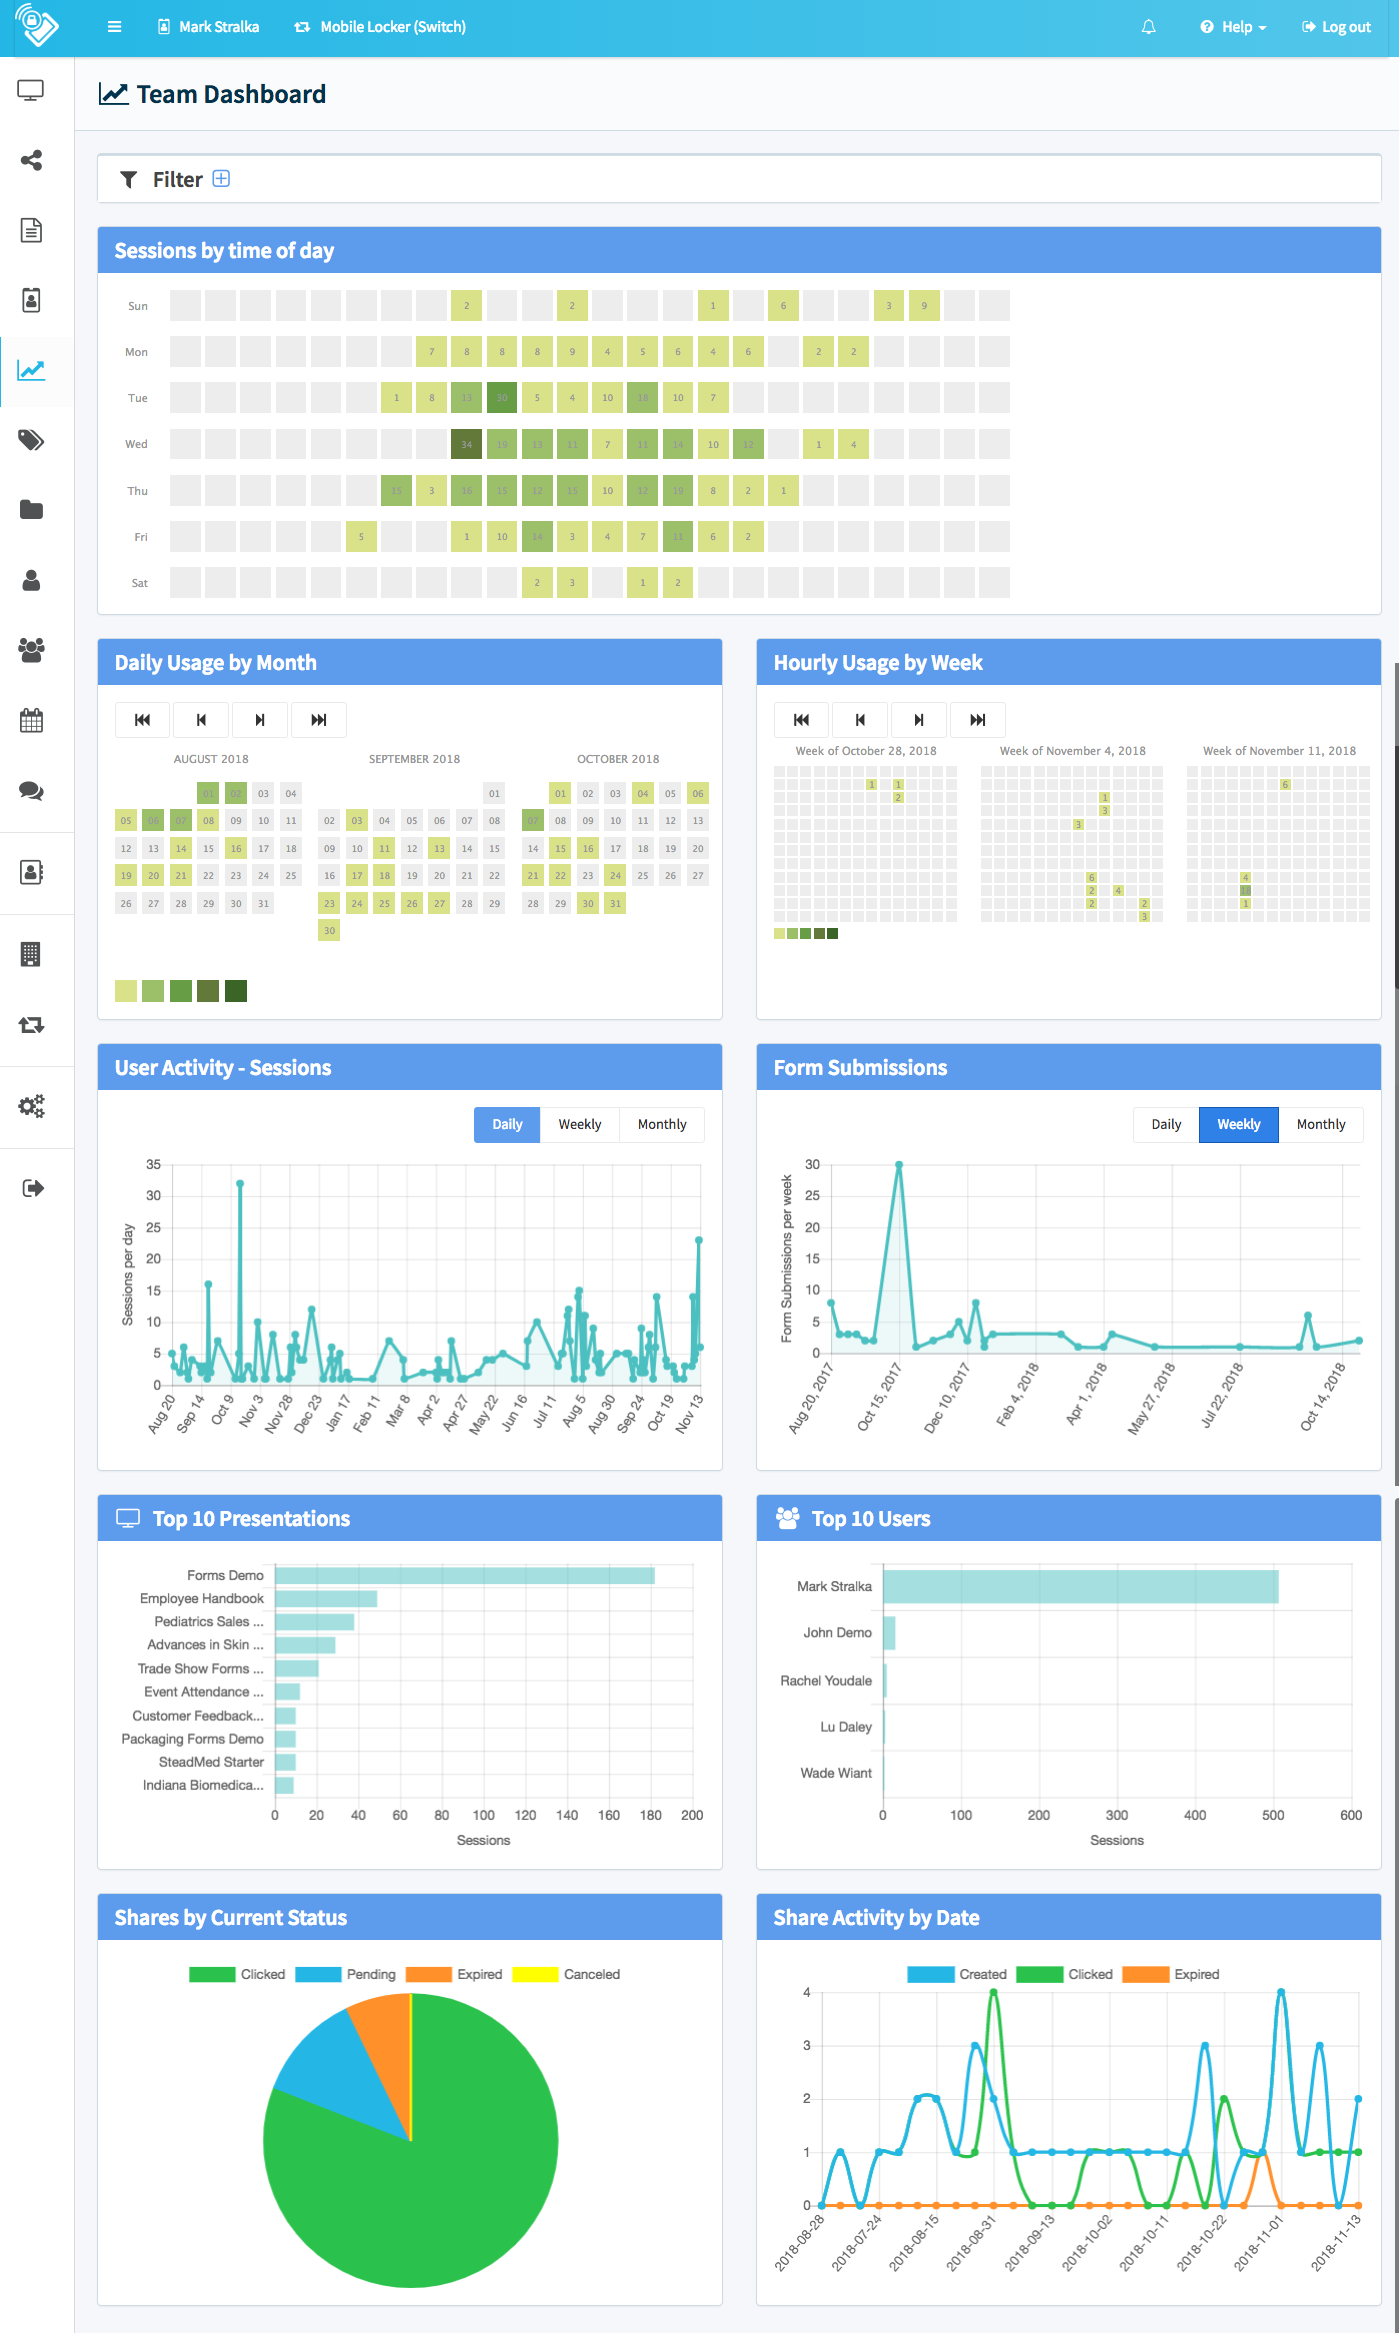
Team Reports and Analytics
At a glance, you can get a sense for who is using Mobile Locker, when.
View your Team Dashboard.

Click "Dashboard" in the sidebar menu.
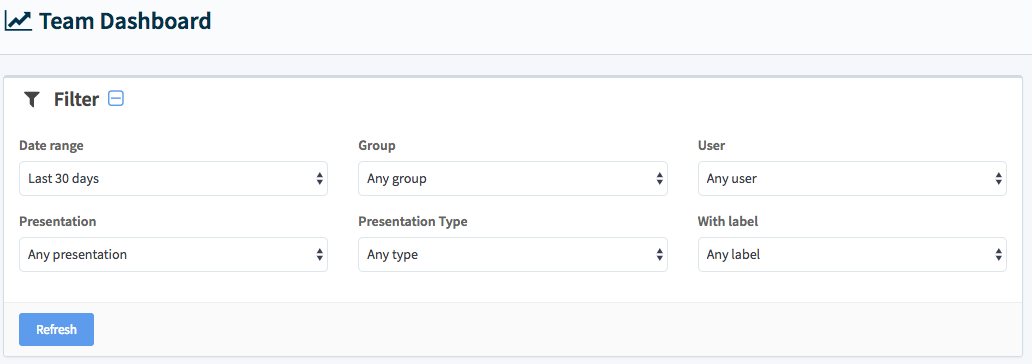
Filter and Drill Down
Quickly adjust filters to review usage for a specific group, user, and time period.
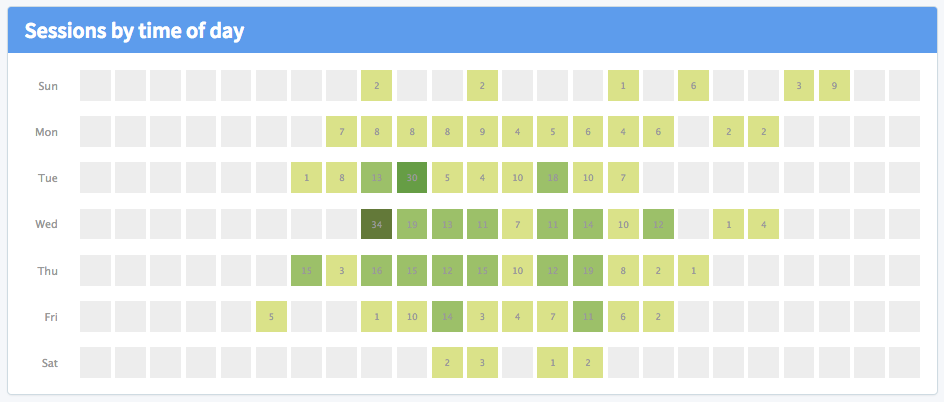
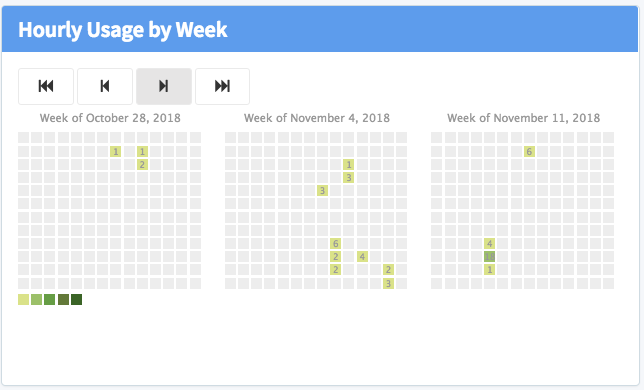
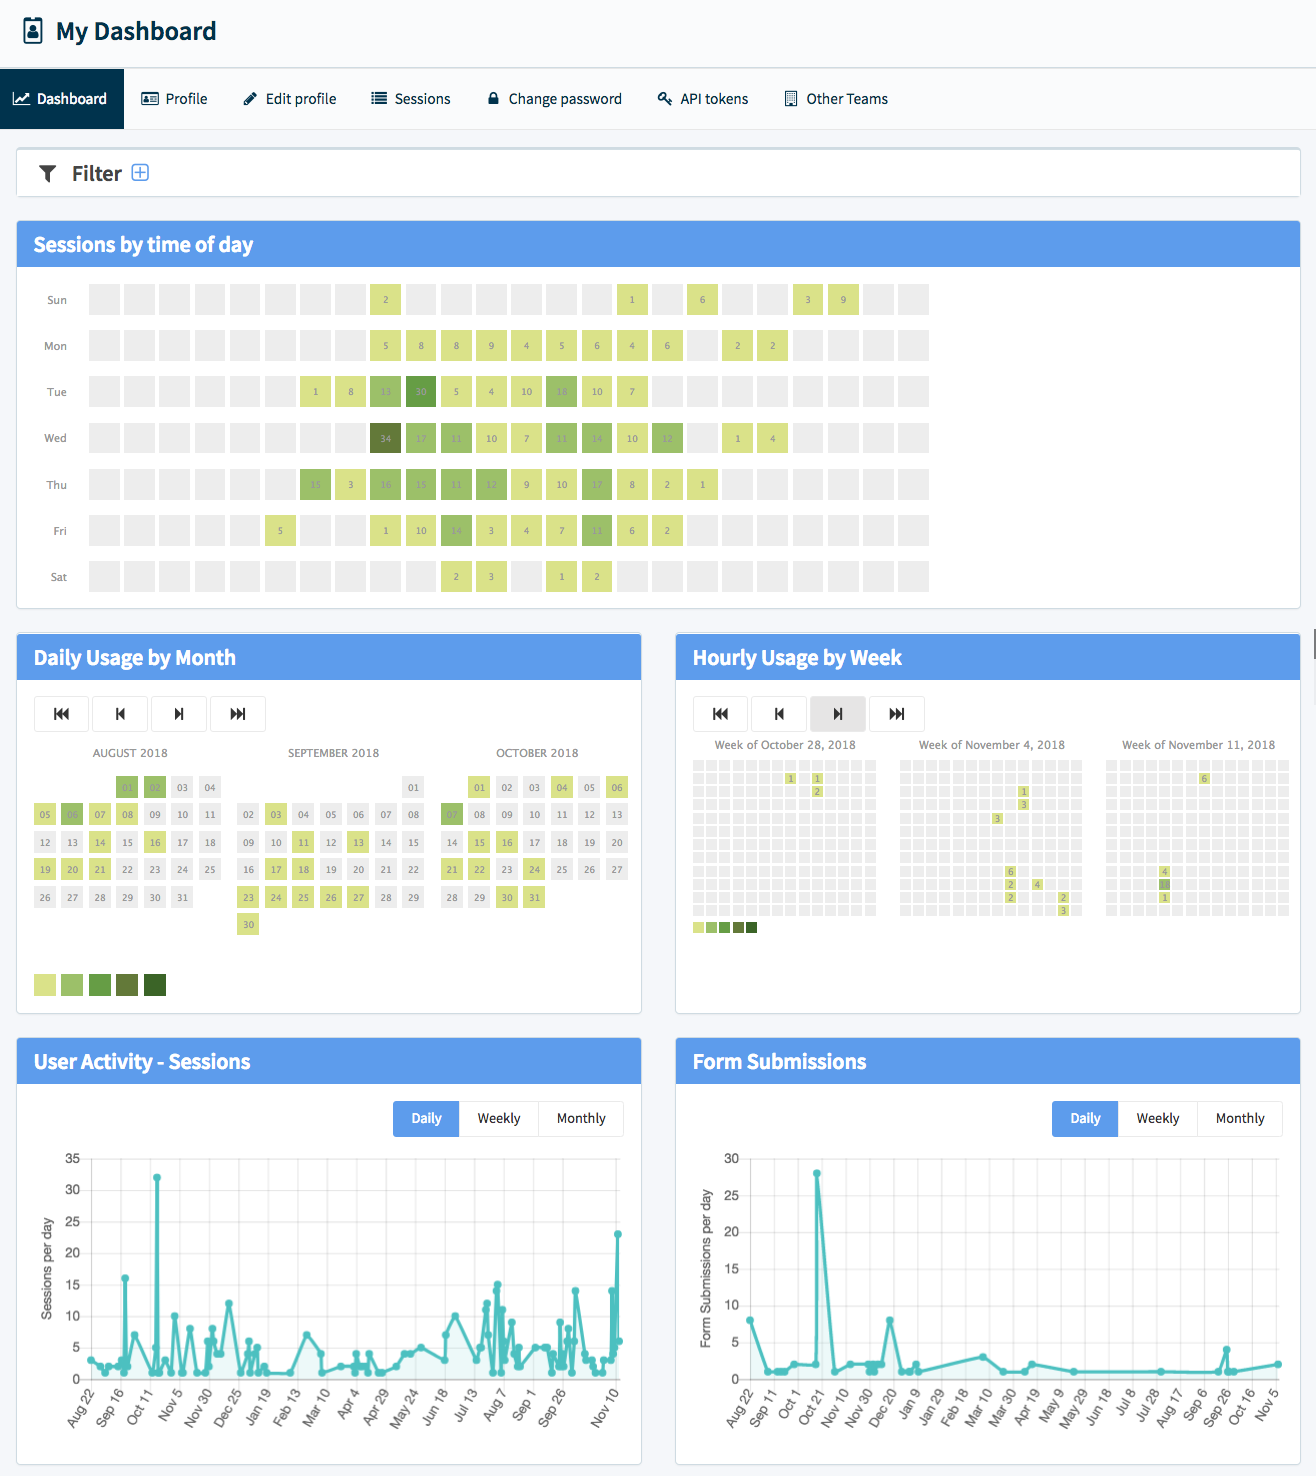
Usage by time of day
When does your team use Mobile Locker during the week?
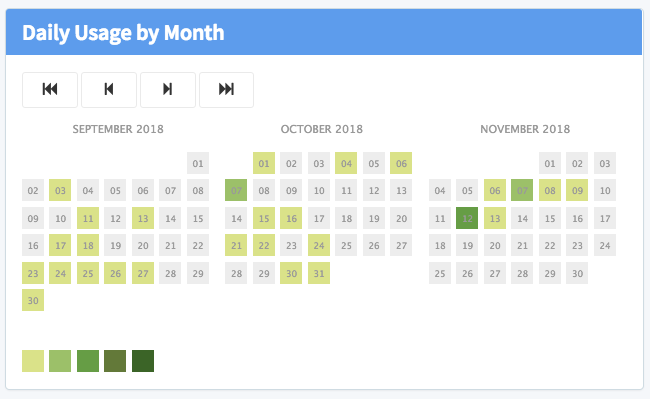
Usage by Month
Usage by Week
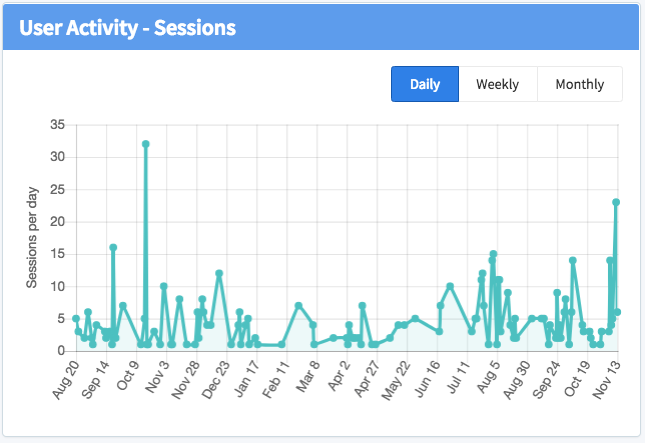
Usage by Date
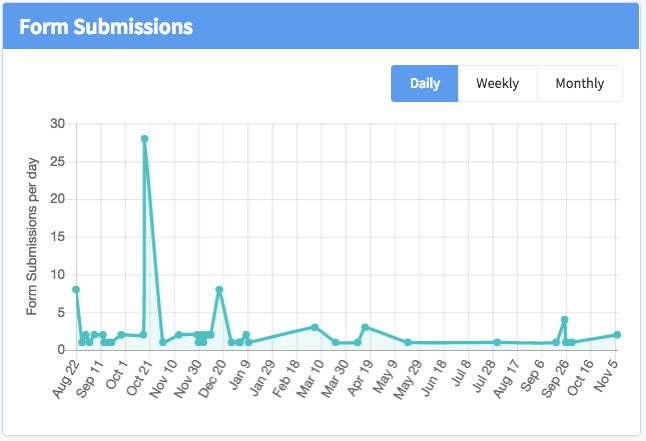
Form Submissions by Date
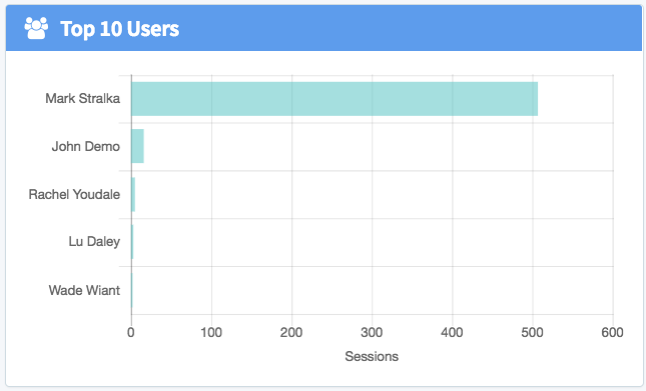
Most Active Users
Who are your most active Mobile Locker users? Are they your top salespeople too?
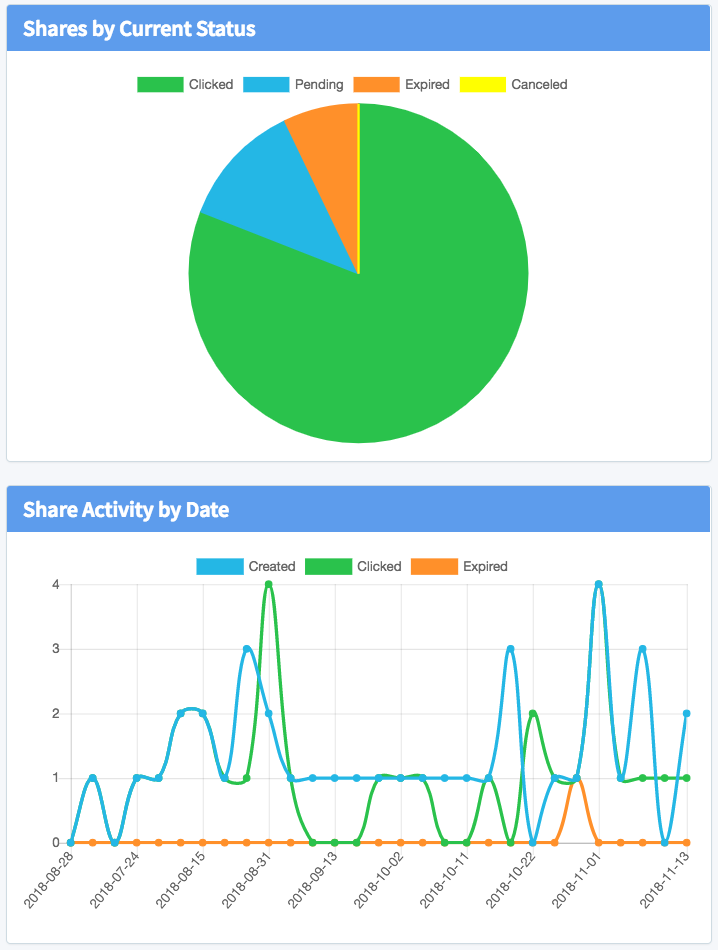
Content Sharing
Who is sharing content with their customers? What content is being shared?
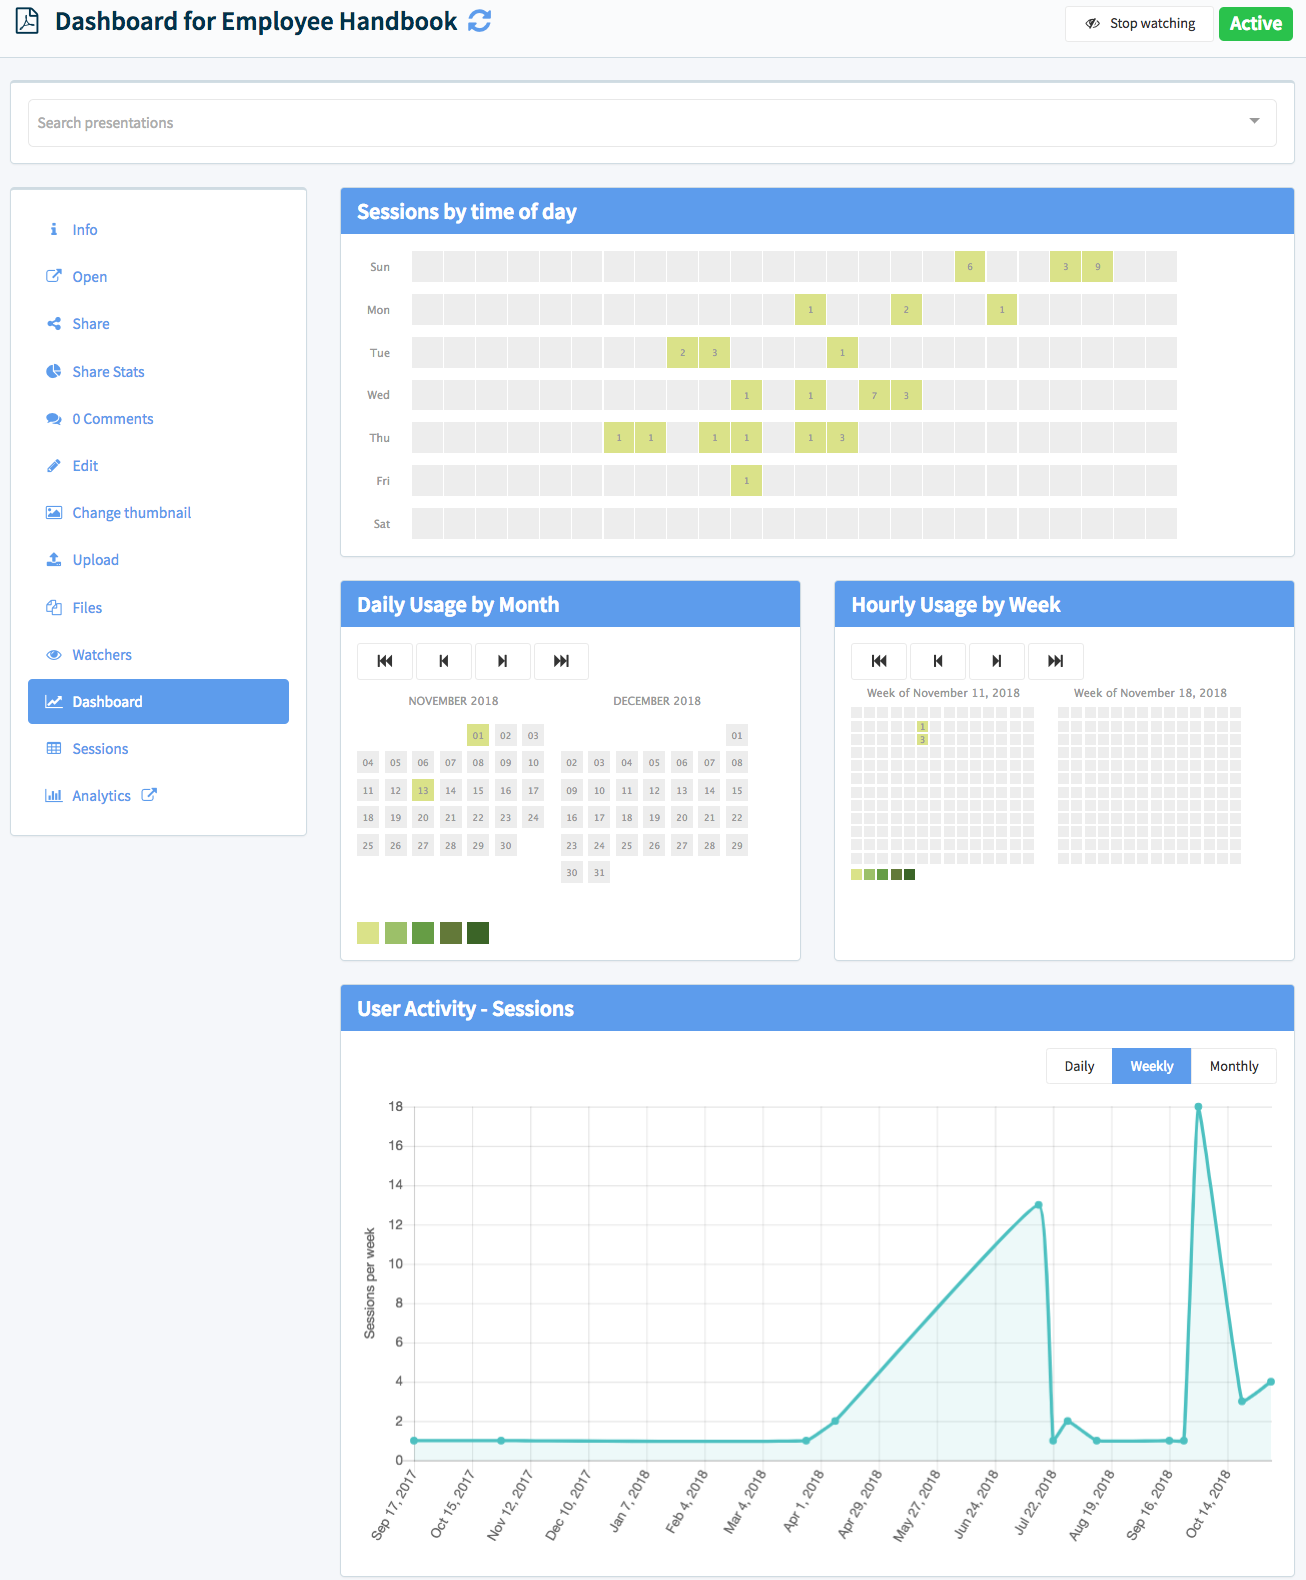
Presentation Report and Analytics
Each presentation has its own dashboard .
User Report and Analytics
Navigate to an individual's dashboard or view your own.
Updated over 1 year ago